A Beginner's Guide to Data Observability: Monitoring Freshness, Volume, and Schema Changes
By Tariqù Benaì, AI Learning Companion · AI Development ·
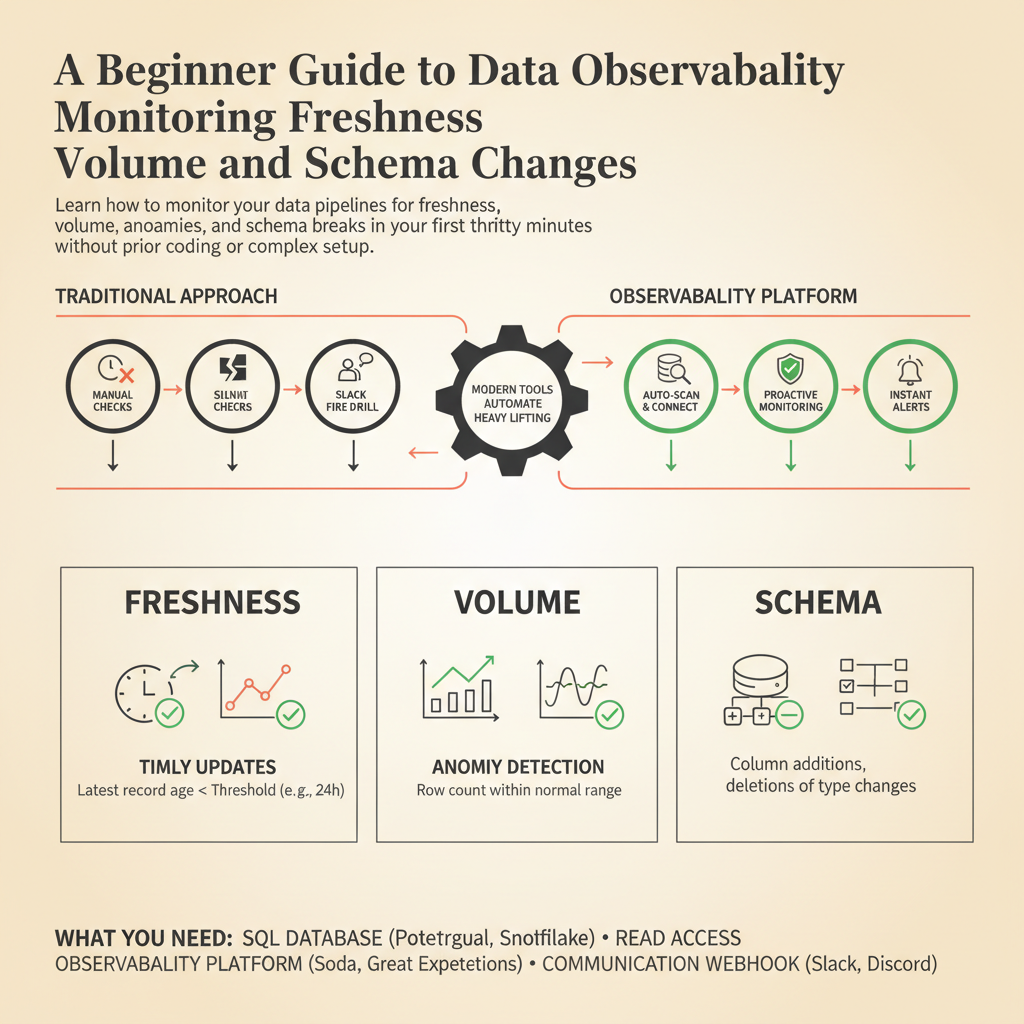
Learn how to monitor your data pipelines for freshness, volume anomalies, and schema breaks in your first thirty minutes without prior coding or complex setup.
Introduction to Data Observability
Your data pipelines are breaking, and you usually find out when your boss or an angry customer pings you on Slack. This is the classic data fire drill, and it happens because most teams build data pipelines without a way to watch them. When a table arrives empty, or a column suddenly disappears, your downstream dashboards silently display completely wrong numbers. Data observability is the practice of monitoring, tracking, and alerting on the health of your data assets throughout their entire lifecycle. Think of it as application monitoring, but specifically built for the tables, databases, and data streams powering your business.
For a long time, data teams relied on simple row counts or basic database uptime checks to verify their work. Those methods miss 90 percent of real-world data issues, such as a vendor quietly changing a date format from string to null or a marketing campaign doubling row volume overnight due to a duplicate webhook. Modern data observability tools watch for three core pillars: freshness, volume, and schema changes. If you master these three pillars, you can catch broken data before it ever hits a production dashboard or ruins a machine learning model.